When estimating emissions between monitoring events, you only have a handful of data points, the actual inspection results. The question is: What do we assume was happening in the hours and days between those readings?
Since no one knows exactly when a component started leaking (or stopped leaking), the EPA has provided several calculation methods for interpolating emissions between inspection events. The three most commonly used are listed below.
- Note: Chateau uses the Modified Trapezoidal Method by default unless another method was specifically requested during onboarding.
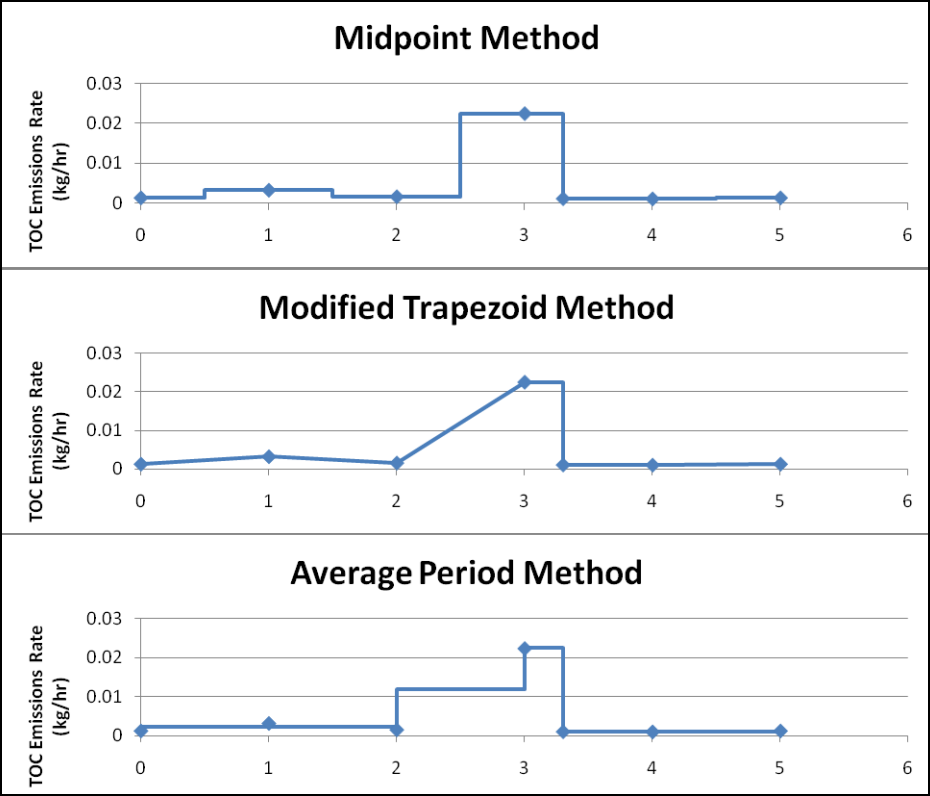
- MidPoint Method
- Concept: The emission rate of the first reading is applied to the first half of the interval, and the emission rate of the subsequent reading is applied to the second half.
- Pros: Simple to apply, balances both readings without averaging them together.
- Cons: Assumes a sudden change between monitoring events, which may not reflect reality.
- Practical benefit: If your monitoring occurs late in the year, the mid-period method usually doesn’t require data from the following year to finish your annual calculation.
- Concept: The emission rate of the first reading is applied to the first half of the interval, and the emission rate of the subsequent reading is applied to the second half.
- Modified Trapezoid Method
- Concept: Takes into account whether emissions are increasing or decreasing between monitoring events.
- If emissions go up: assumes a gradual increase, using the average of the two rates across the interval.
- If emissions go down: assumes the initial rate persists until the new, lower reading.
- If emissions go up: assumes a gradual increase, using the average of the two rates across the interval.
- Pros: Provides a more nuanced estimate when emissions are trending upward or downward.
- Cons: More complex, and it often requires the next year’s data to finalize annual emissions if the last inspection occurred before year-end.
- Concept: Takes into account whether emissions are increasing or decreasing between monitoring events.
- Average Period Method
- Concept: Uses the arithmetic average of the two adjacent emission rates across the entire interval (except when a leak is found — in that case, the leak rate is used until retest).
- Pros: Straightforward, consistent, and easy to calculate.
- Cons: Like the trapezoid method, it usually requires next year’s data to close out an annual inventory period.
- Concept: Uses the arithmetic average of the two adjacent emission rates across the entire interval (except when a leak is found — in that case, the leak rate is used until retest).
Treatment of Leaks
Regardless of the method, one consistent rule applies:
- If a leak is detected, the leak rate must be applied from the time it is found until the retest confirms it is repaired.
- This ensures emissions are not artificially reduced by interpolation during a leak condition.
Mathematical Equivalence
When the calculation period begins and ends on monitoring events (for example, your inventory year aligns with inspection dates), all three methods produce the same total emissions.
The only differences occur when a reporting period must be cut between two inspections, such as at a calendar year boundary. In those cases, the three methods may allocate emissions slightly differently. However, when you add up emissions across thousands of components, these small differences tend to cancel out.
Worked Example: Same Data → Same Total
Setup (one interval):
- Start reading: 100 ppm on Jan 1
- End reading: 1,000 ppm on Apr 1
- Interval length: 2,160 hours (about 3 months)
- Correlation equation (from EPA factors for this service):
Leak Rate (kg/hr) = 2.29 x 10⁻⁶ x (PPM)0.746
Step 1: Convert ppm readings to leak rates
- Start (100 ppm):
- A = 2.29 x10-6 x (100)0.746 ≈ 0.000126 kg/hr
- End (1,000 ppm):
- B = 2.29 x 10−6 x (1000)0.746 ≈ 0.000700 kg/hr
Step 2: Apply each method
- MidPoint Method
- First half at A, second half at B:
- Emid=A x + B x = x H
- Emid=A x + B x = x H
- First half at A, second half at B:
- Average Period Method
- Constant average across the whole interval:
- Eavg = x H
- Eavg = x H
- Constant average across the whole interval:
- Modified Trapezoid Method (increasing case)
- Average of the two rates across the interval:
- Etrap = x H
- Average of the two rates across the interval:
Step 3: Numeric check
x H = x 2160 = 0.000413 × 2160 = 0.892 kg
All three methods produce 0.892 kg for this interval.
What about decreases and leaks?
- Decreasing intervals (A→B with B<A):
The modified trapezoid method applies a conservative rule (hold the initial higher rate) until a retest is documented. In practice, when you apply the EPA leak rule consistently (i.e., use the higher “leak” rate from detection until a retest confirms repair), the totals across the sequence of intervals are aligned across methods because the same high-rate hours are counted in all cases. - Key takeaway: With the same inputs (same inspection points, same hours) and the same leak/repair rule (hold leak rate until retest), the methods are mathematically equivalent on totals. They differ only in how they apportion the rate within an interval, not in the final sum.